- 2021/2022 -
Machine Learning Demos and Data Visualization
Machine Learning Demos and Data Visualization
Showing is better than telling
SambaNova Systems required a visually interactive way to demonstrate their technology for different industries.
ROLE:
Sr. Principal Product Designer
UI/UX
Product Strategy
User Research
Sr. Principal Product Designer
UI/UX
Product Strategy
User Research
SCOPE:
2 Weeks
2 Weeks
PLATFORM:
Desktop - Mobile
Desktop - Mobile
TOOLS:
Figma
Adobe Illustrator
Figma
Adobe Illustrator
TEAM:
Six person
Six person
MARKET :
B2B SaaS
B2B SaaS
INDUSTRY:
AI/ML
AI/ML
INTRODUCTION
SambaNova is working to create a more accessible AI platform for businesses. The company targets enterprises that want to integrate sophisticated AI systems into their business yet lack the resources to develop and maintain in-house programs.
It was December 2022, and after raising $676M at a $5.1B valuation after four years of uninterrupted growth, SambaNova Systems decided it was time to showcase its capabilities to run Machine Learning processes impacting the biggest industries in the world.
It was December 2022, and after raising $676M at a $5.1B valuation after four years of uninterrupted growth, SambaNova Systems decided it was time to showcase its capabilities to run Machine Learning processes impacting the biggest industries in the world.
THE PROBLEM
The company has developed incredible solutions to unlock billions of dollars in trapped data and needed an easy and clear way to demonstrate them to the public.
The challenge was creating a place where these solutions were easy to understand, aligned with communication and marketing concepts, creating examples for market leaders to feel related, and, most importantly, showcasing the company's capabilities to impact these businesses.
The challenge was creating a place where these solutions were easy to understand, aligned with communication and marketing concepts, creating examples for market leaders to feel related, and, most importantly, showcasing the company's capabilities to impact these businesses.
THE CHALLENGE
The final asset should be something that can be used at an event on big screens where attendants could interact and run these demos themselves but simultaneously flow within a story that makes the user land in the final statement of Sambanova as the key.
These demos should be fully functional to make a real impact on the spectator. So a multidisciplinary team was formed from Data Scientists to Front-end Engineers, Product Managers, Marketers, and myself, as Product Designer.
These demos should be fully functional to make a real impact on the spectator. So a multidisciplinary team was formed from Data Scientists to Front-end Engineers, Product Managers, Marketers, and myself, as Product Designer.
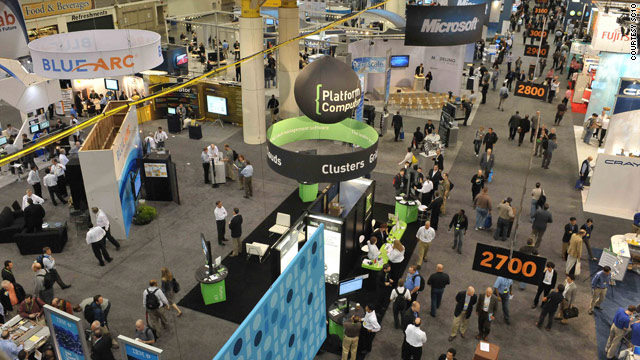
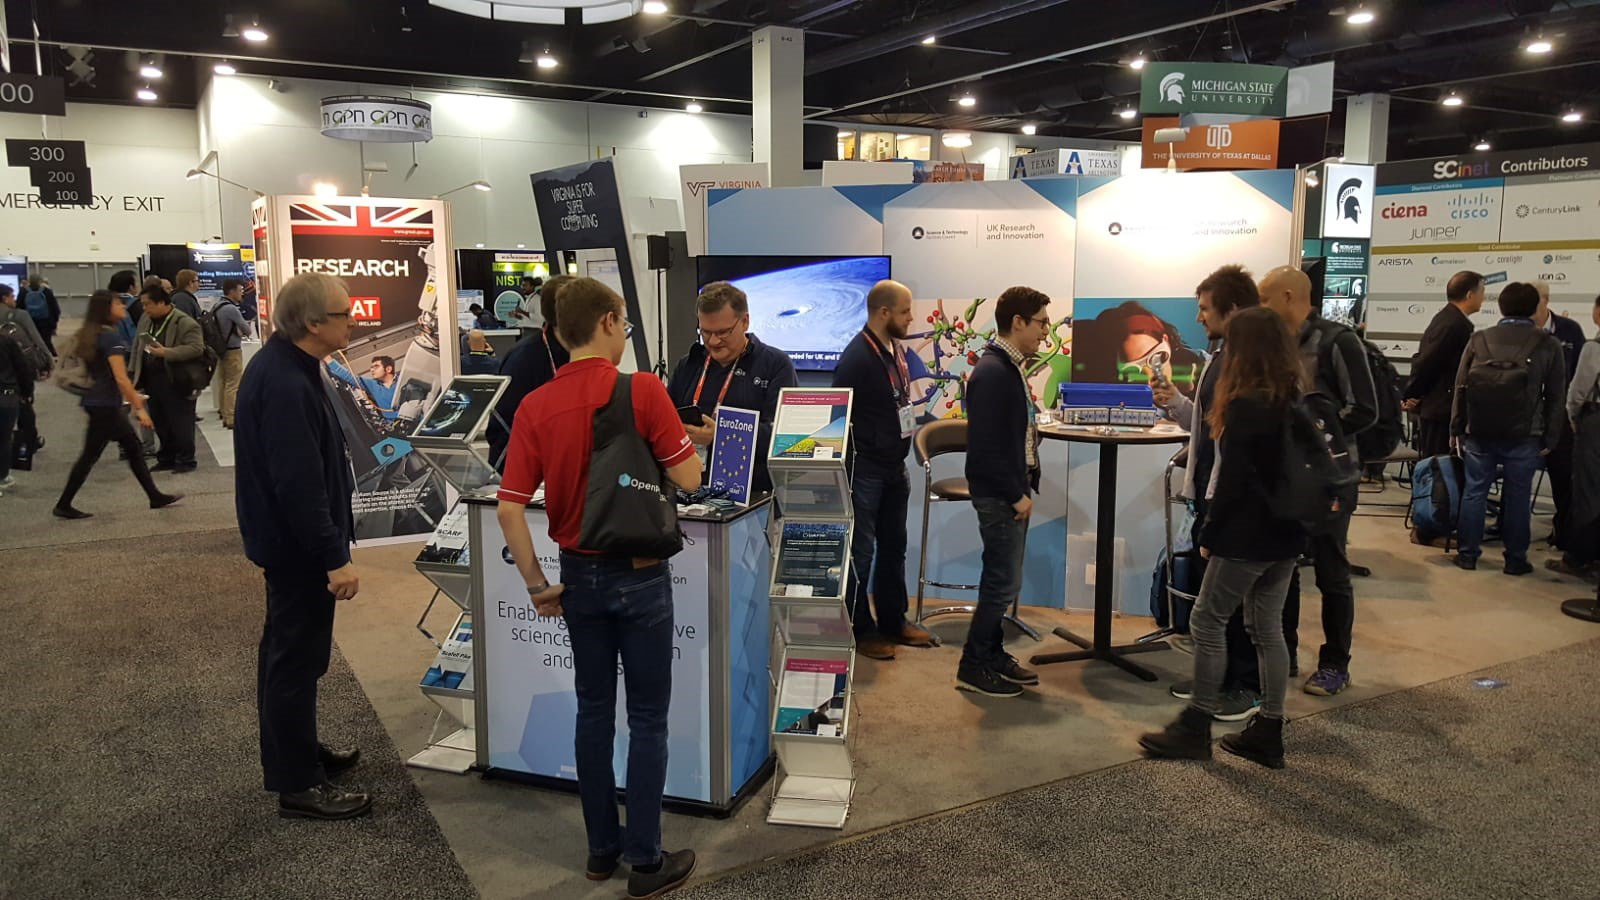
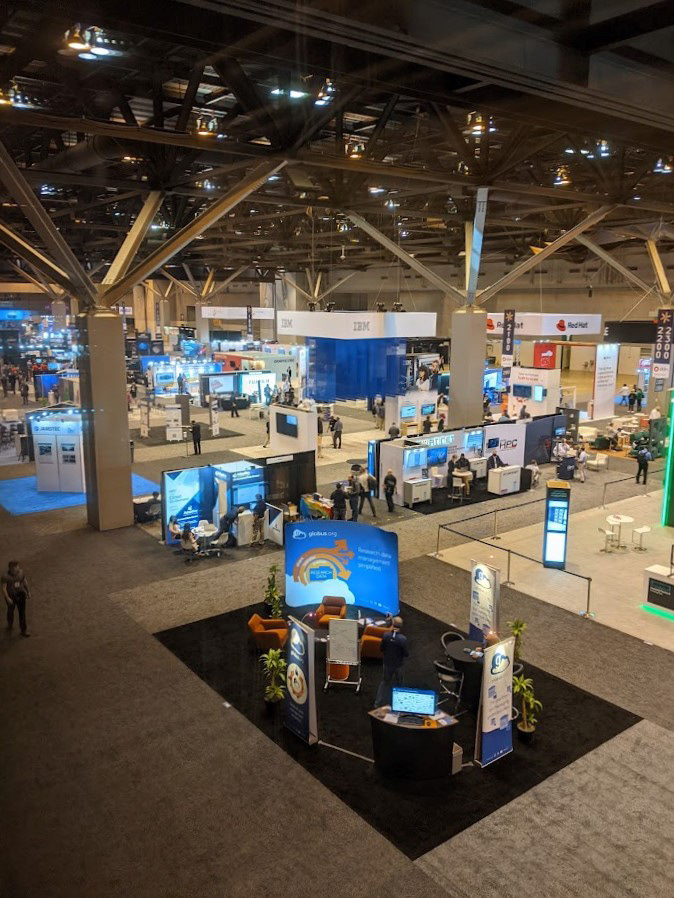
The series of demos should be available for attendants to interact with at different conventions and events like Supercomputing 2022
THE PROCESS
Due to a very tight schedule, we defined a story for each demo with the MKT person, and the PM linked to the capabilities our Data Scientists confirmed. After understanding the details of each case I defined the visual aspects, and we defined each experience.
My task was to create the entire experience in Figma, putting all the pieces together to recreate what the UX would look like from the UI, and text layout to graphic creation.
My task was to create the entire experience in Figma, putting all the pieces together to recreate what the UX would look like from the UI, and text layout to graphic creation.
From quick wireframes to high-fidelity interactive prototypes in Figma, the team was able to align the story with the required text, images, and graphics. I worked closely with the front-end and data scientist team during implementation to achieve the desired impact when running the experience.
Going deeper and deeper in every case, I was required to create animations, graphics, and illustrations to help visualize and generate impact.
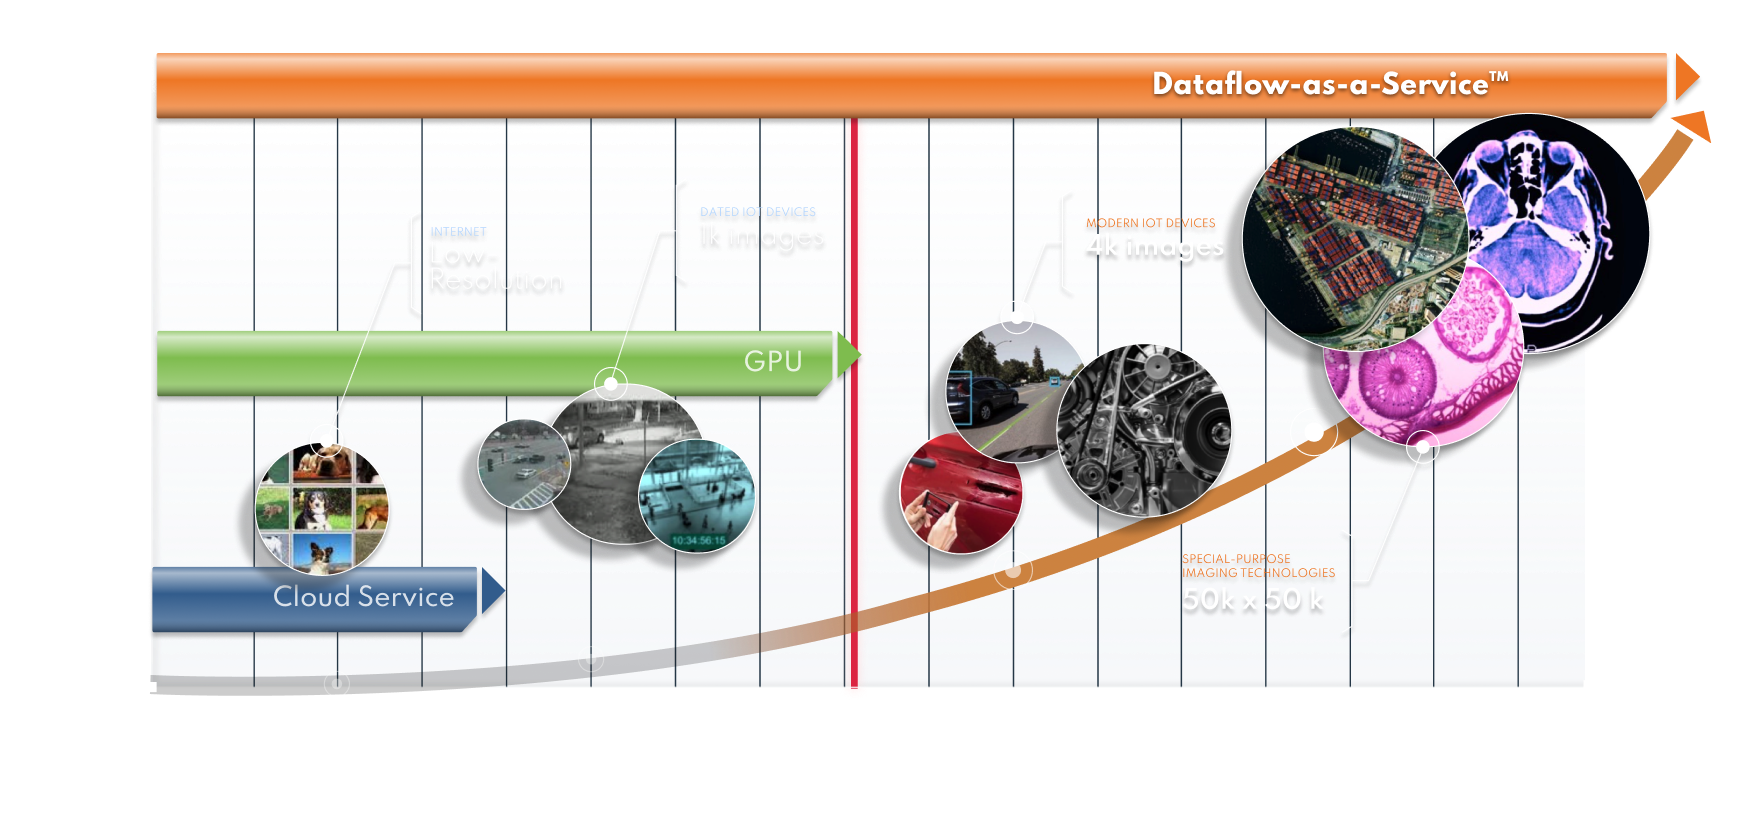

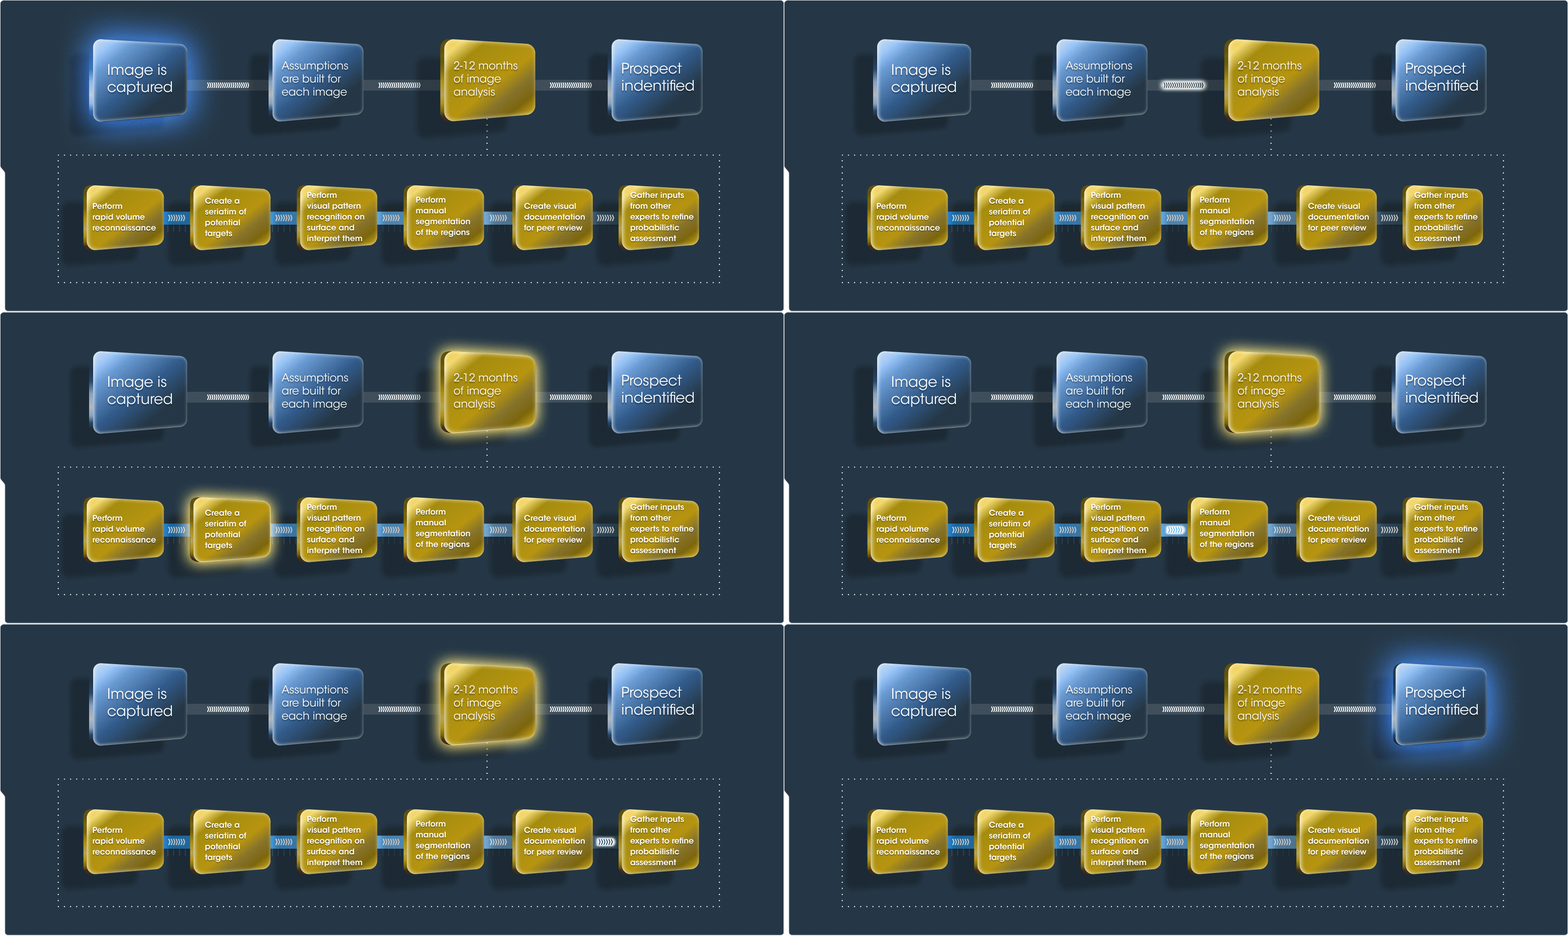

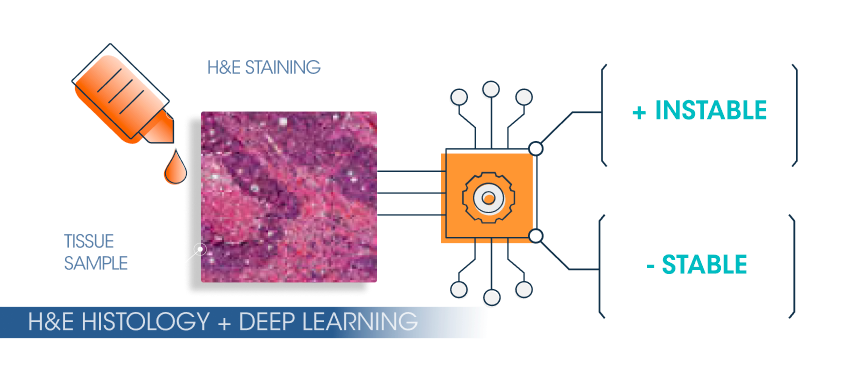
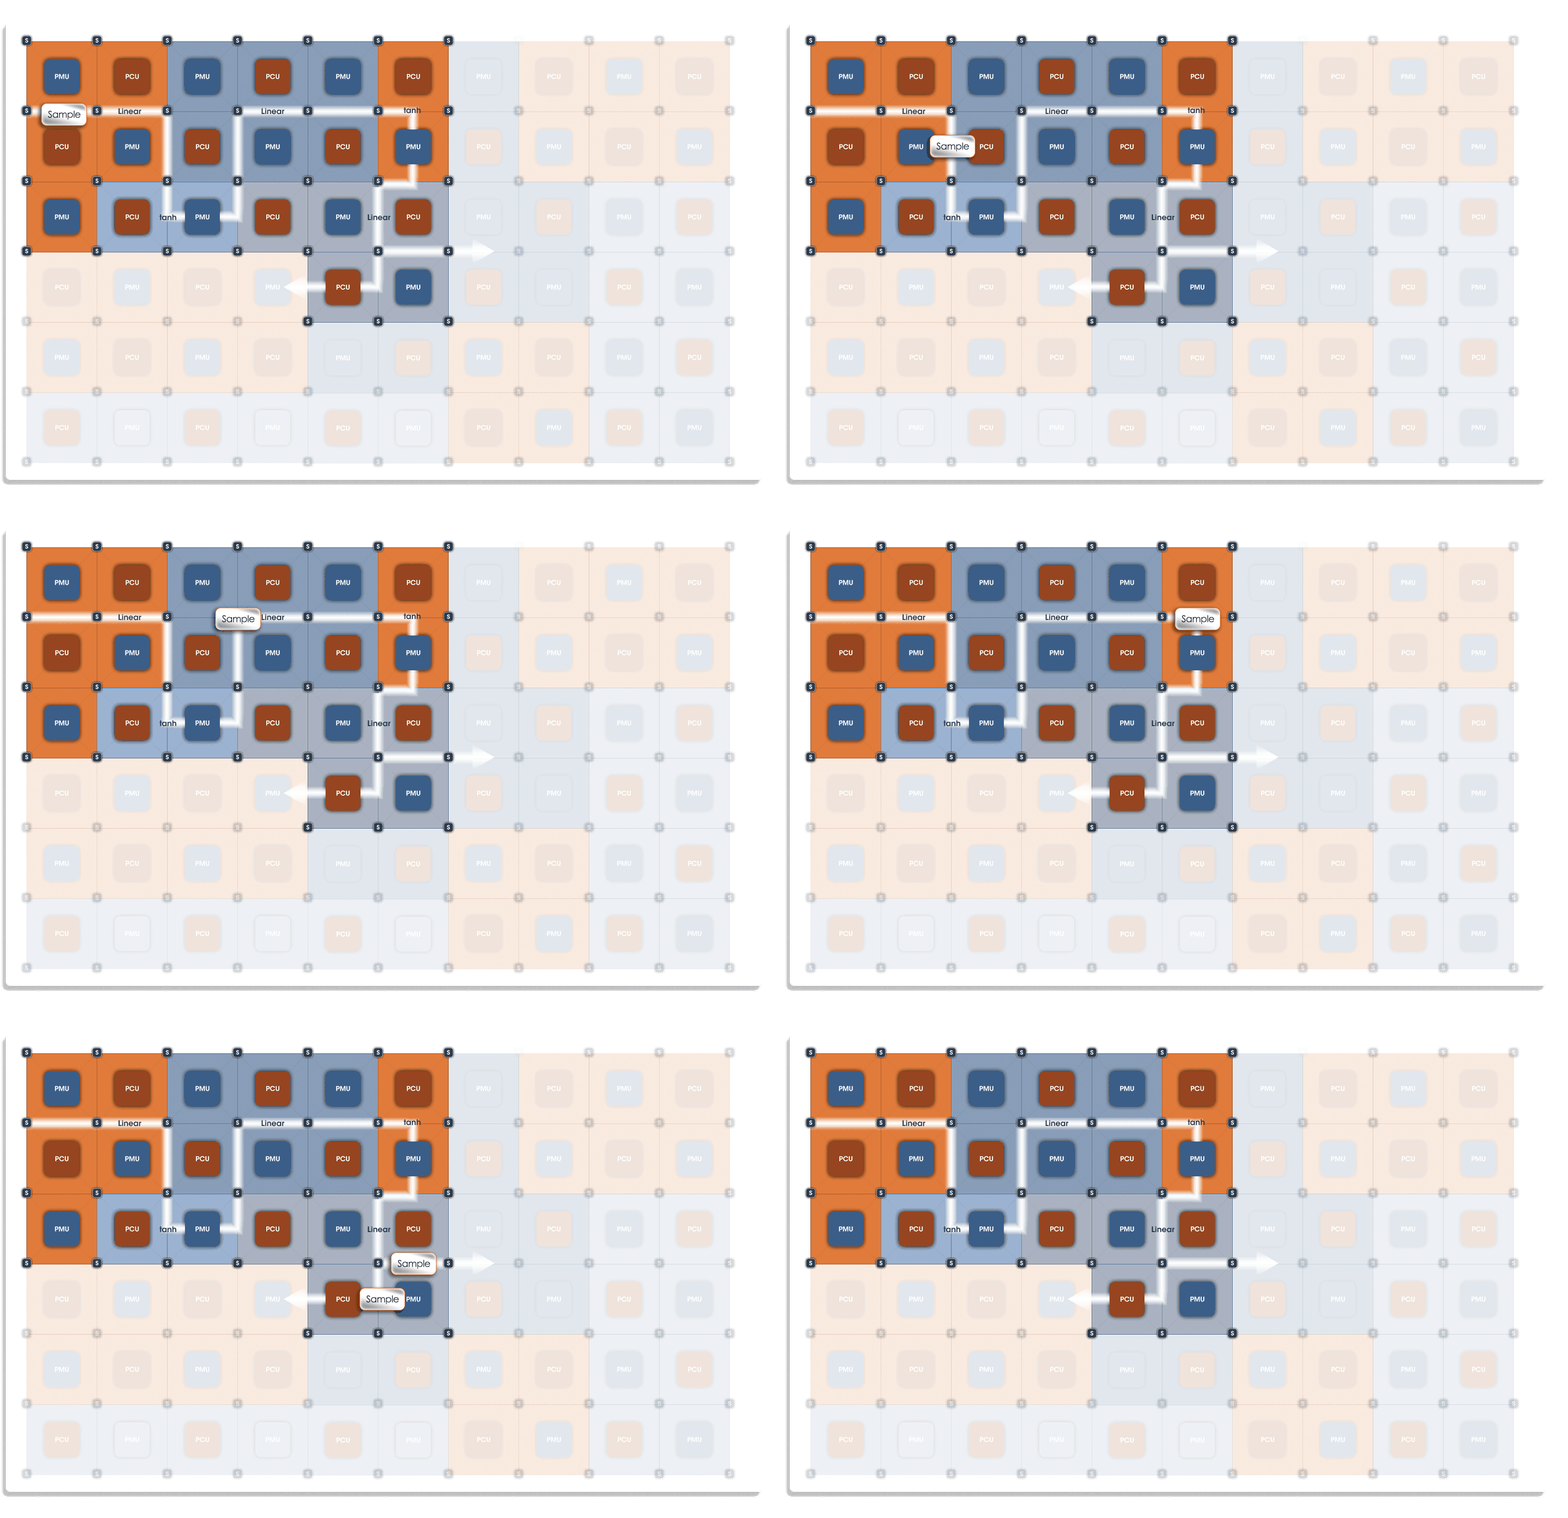
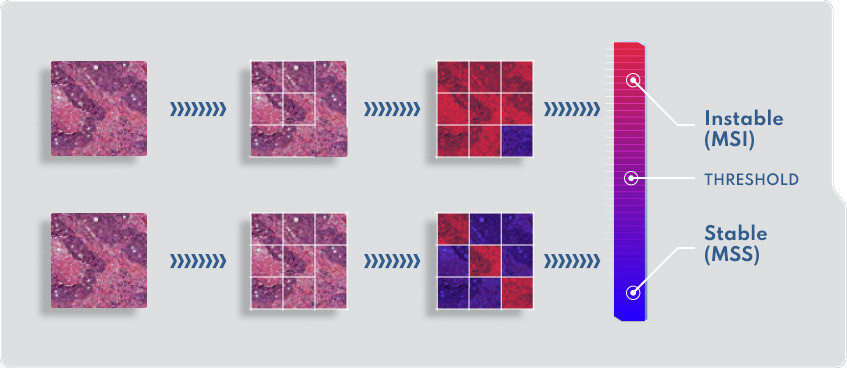

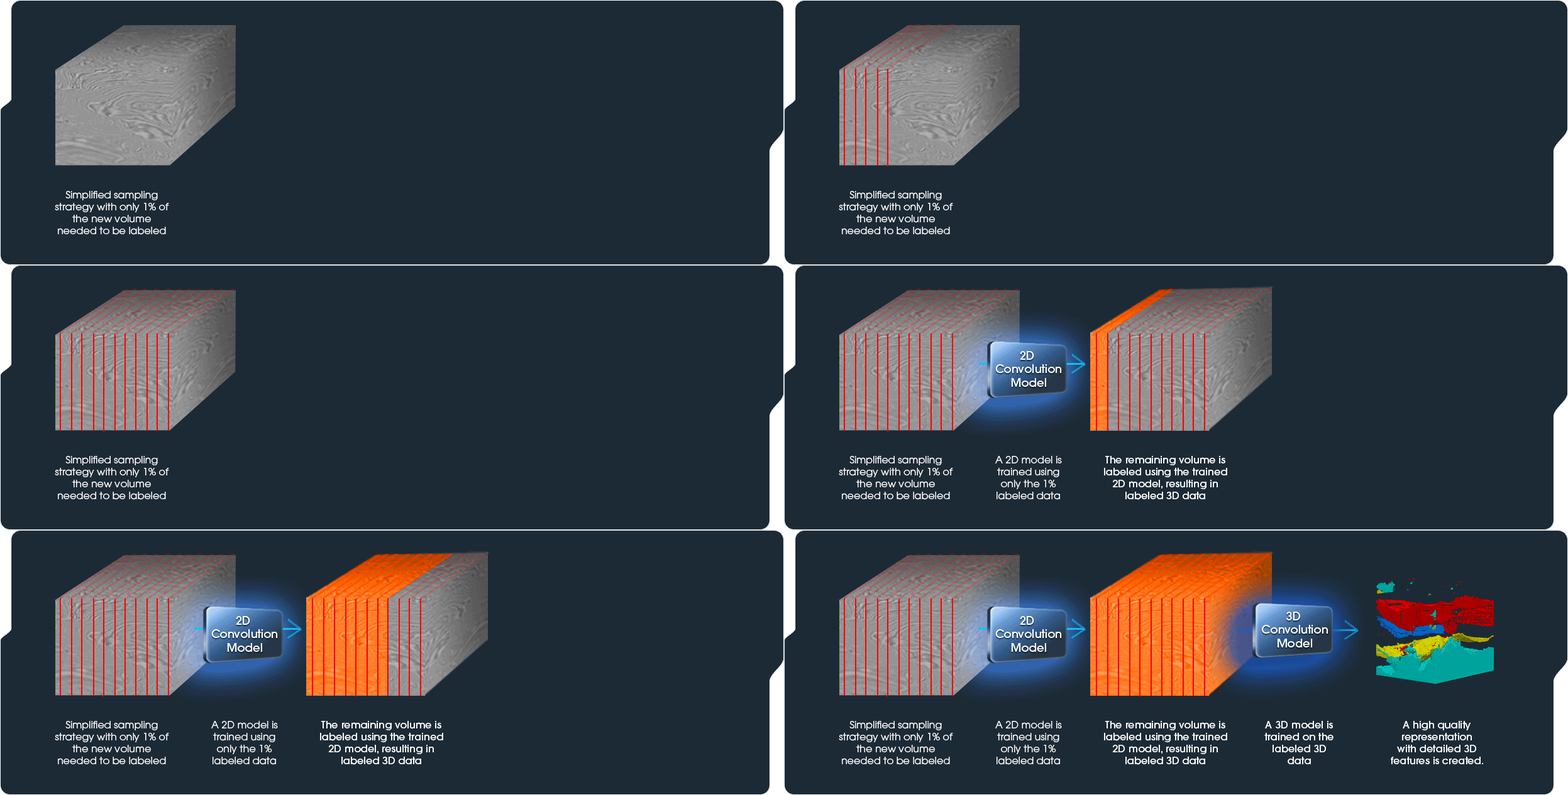
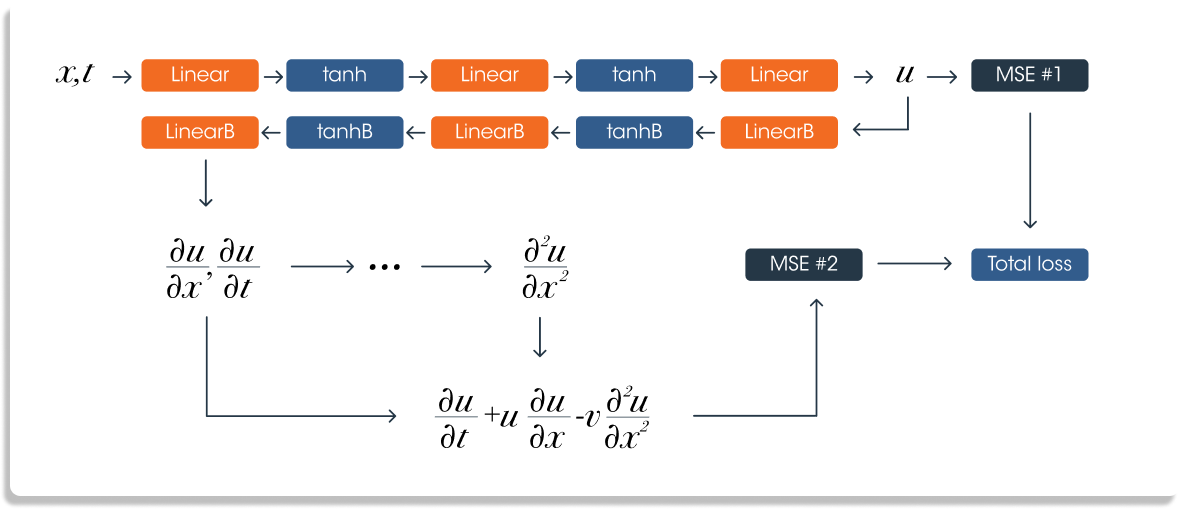
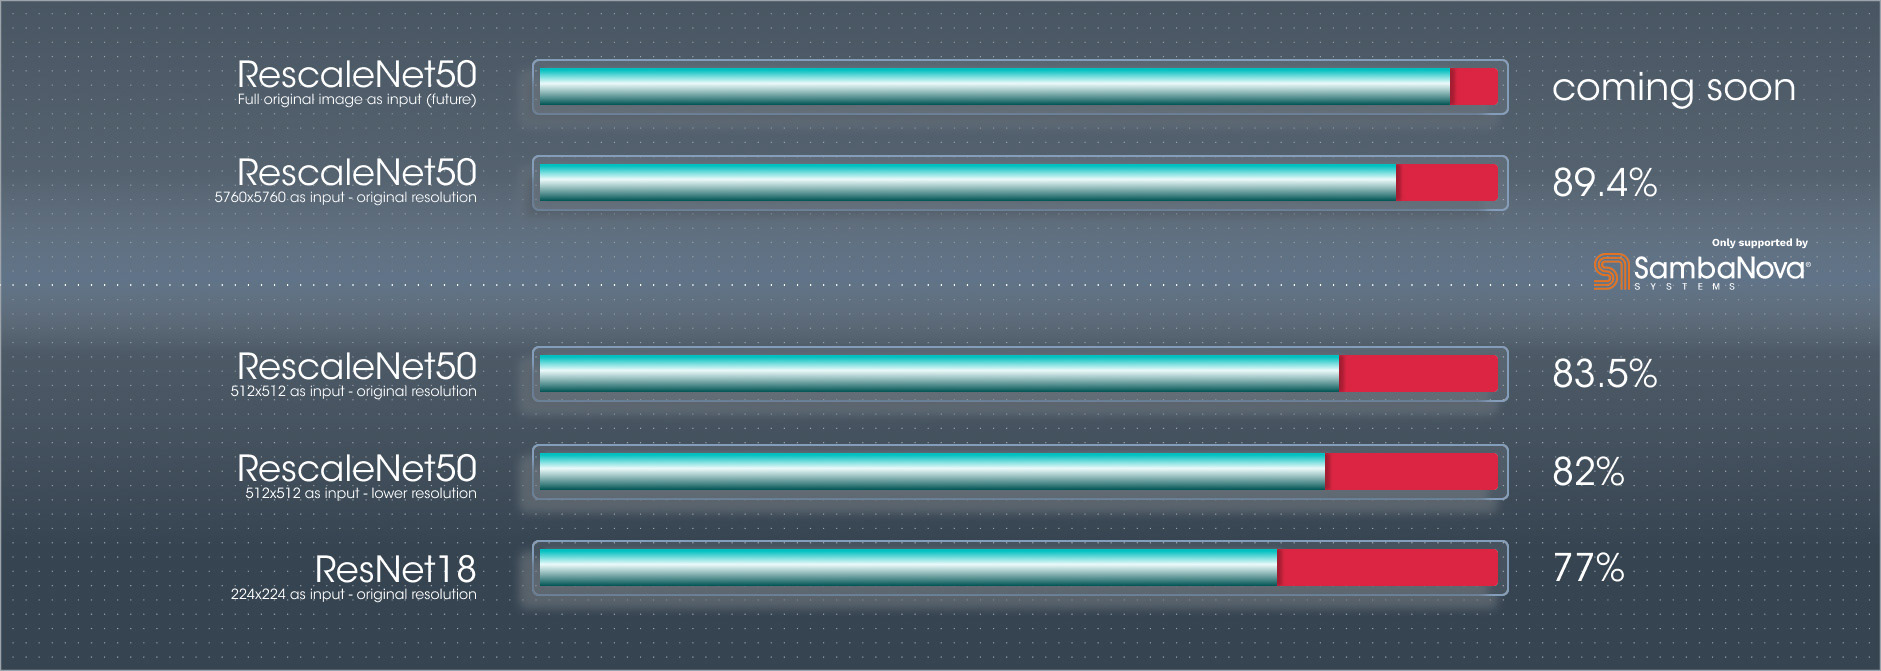
THE EXPERIENCE
To share the desired message in the most impactful way, a series of experiences where the users can interact with the demo live. To create an intuitive interface, and define the timeframes, and content per screen, I put myself into the user's shoes by understanding each space and its knots and bolts.
Human Document Classification animation for Large Language Models demo.
The benefit of using Large Language Models against human Document Classification
Simulation at the Computer Vision demo for MSI status for Cancer treatment decision.
Sentiment analysis from fine-tuning Large Language Models (LLM) for banking.
The result is a clean and intuitive group of landing pages grouped by a launcher. Every demo has interactive capabilities where the user can explore and experiment firsthand.
THE LEARNINGS
As a Product Designer, one of the most important things is understanding the user's needs and pain points. In this case, learn about Large Language Models for Document Classification, True Resolution Computer Vision for Object Detection, Domain adaptation for Sentiment Analysis, 3D Segmentation for Kidney tumor detection, Physics Informed Neural Networks, and 3D Seismic Analysis for Oil and Gas detection.
Team members
Jimmy Lin
Product Manager
Product Manager
Eric Goelz
Product Marketing
Product Marketing
Rajesh Ottikunta
Front End - Software Engineer
Front End - Software Engineer
Kenneth Huang
Front End - Software Engineer
Front End - Software Engineer
Bill Bain
Content Strategist
Content Strategist
